When I founded Huff Industrial Marketing in 2014, I did so with one objective in mind: I wanted to create a business based on tested practices — tested by me!
For years, I had read research and listened to industry gurus talk about how companies didn’t know if their marketing was working. This was mostly due to department silos, lack of agreement on what to measure, etc.
So in 2014 I said, “I want to change this. When manufacturers hire us, I want to prove the marketing my team and I provide actually works.”
School of trial and error
Early on, I made some mistakes because I was still operating under what other people said worked. I also didn’t have my own internal measurement systems in place.
I began looking for ways to show how the websites were delivering leads. I learned Google Analytics inside and out. By 2018, I was providing clients with simple conversion reports.
The wonderful benefit of doing these reports is that the more my team and I analyzed data and applied it, the better we became at creating websites for manufacturers that delivered real leads, and more importantly, helped them increase revenue.
I also made the very smart decision in 2022 to move all clients from GA4 to Matomo Analytics. Never looked back.
2023: Introduced the new Conversion Report
My son James, a software coder, was laid off, which freed him up to work for me. I asked if he could automate the conversions reports, which I had been compiling manually each week and month.
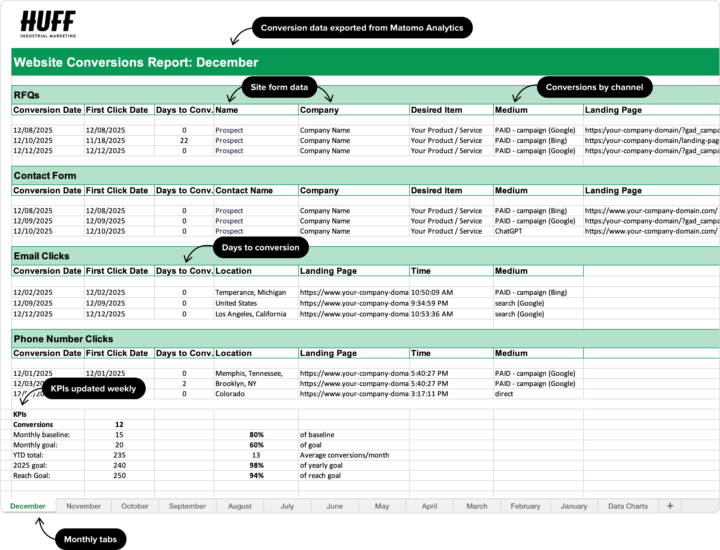
He went to work. Using the Matomo Analytics API, he created a function where data is exported directly into the new spreadsheet you see in the header image above. (Our designer, Rachel Cunliffe, designed it.)
What a huge difference this report has made! Clients love it.
Since its introduction, we’ve made continual tweaks based on feedback:
- Each report includes monthly tabs, so that clients can see conversion data by month and year-to-date.
- KPIs are listed on each current month and are updated weekly. If the goal is 30 lead conversions per month, the client can see immediately where we stand.
- WordPress RFQ form data is matched to Matomo data; we manually add the name and company of the inquiry; clients also have other data they want to track, so that gets added as well.
- The report shows conversions by channel, which means we track where the lead came from: Ads, non-paid search, AI agents, LinkedIn (or other social), etc.
Clients and I now easily track won proposals back to these reports. I do a little dance each time this happens. Woohoo!
The metric of which we’re most proud: Days to Conversion
Huff Industrial Marketing clients see an amazing 70% or higher Zero Days to Conversion metric.
What this means is, a prospect comes to the website and converts on the same visit: Completes the RFQ or other form, emails, or calls. (All form submissions are manually reviewed; spam ones are removed. Ditto for obvious email spam.)
What the Days to Conversion metric tells us:
- The websites we create become huge trust signals because they were professionally designed and built based on client goals and objectives.
- The content — from copy to images — demonstrates the client’s expertise and quickly establishes trust. Content is always written for the client’s audience versus Google.
We don’t do “cool” or trendy. Instead of asking AI agents for ideas or strategy, my team and I continually work with clients to refine, refine, refine based on what sales hears from customers and prospects.
And so, people reach out — whether they come to the website from “free” search, paid search, word of mouth, or wherever.
Most importantly, however, is that the Days to Conversion metric proves our holistic (and dare I say, human) approach to marketing works. We have the results to prove it.
Conversion Tracking is part of the Lead Generation Marketing Program for Manufacturers. This program includes Content Marketing and Pay-Per-Click advertising. It’s an integrated approach that works. We have the receipts to prove it.